Age and Sex Profile
This report provides demographic insights into the age and sex of the Ghanaian population with specific highlights in youthfulness, ageing, working age and dependent populations.
Table of Content
Highlights
Age distribution of population by sex
Ghana’s population age structure is transitioning from one dominated by children (0-14 years) to one dominated by young people (15-35 years): The proportion of children declined from 41.3 percent in 2000 to 35.3 percent in 2021, while that of young people increased from 34.6 percent in 2000 to 38.2 percent in 2021.
Figure 1: Population pyramid
Age distribution of population by locality and region
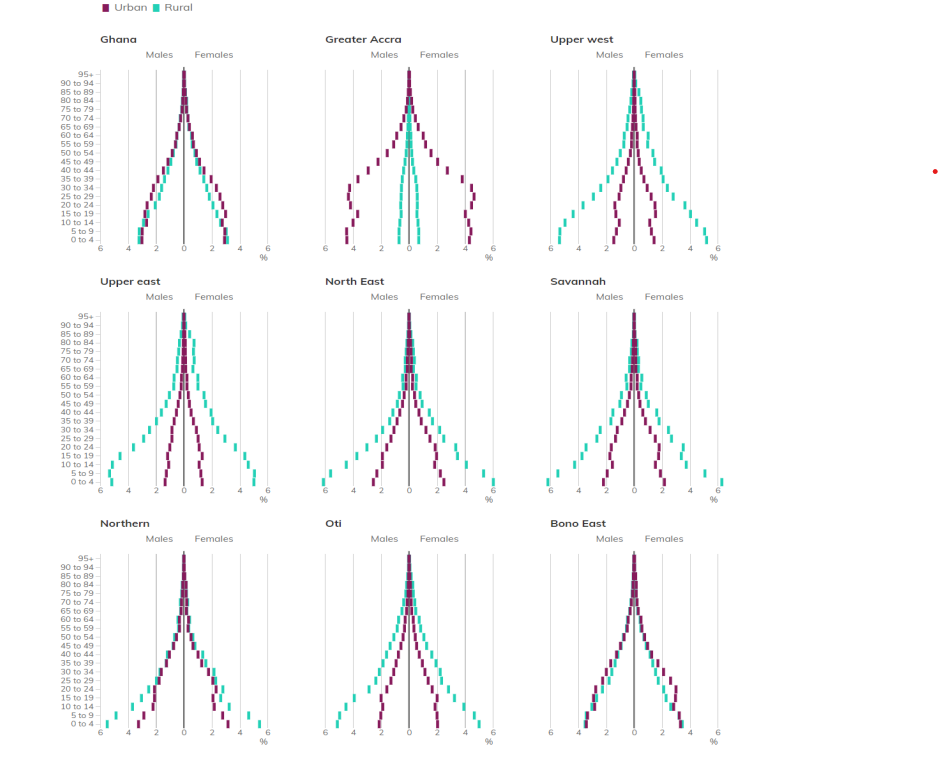
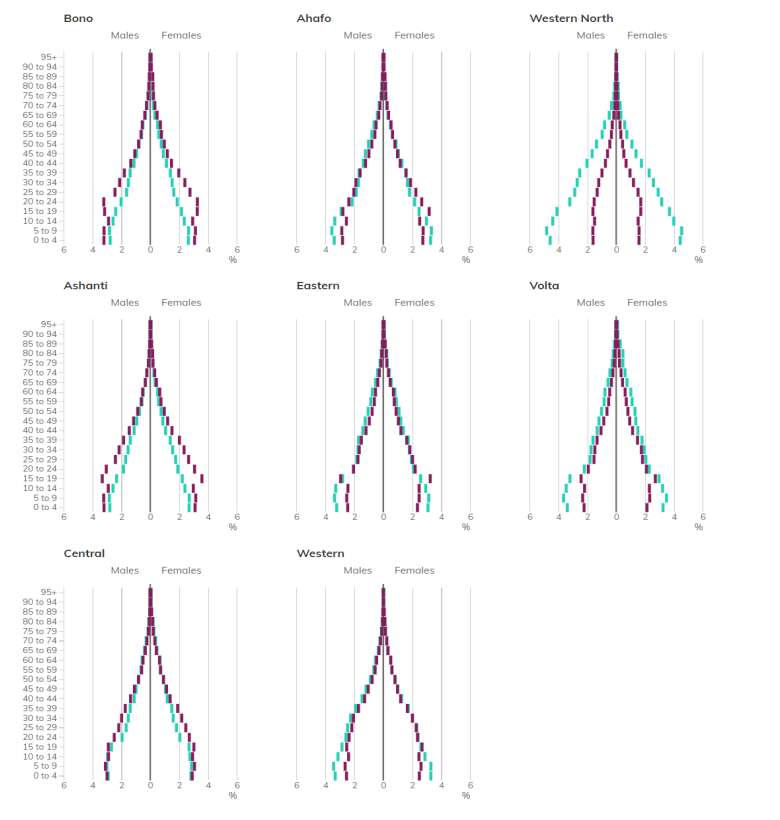
The transitioning of the population from children to young people is evident in all regions and in urban areas. In urban areas, Greater Accra depicts the most pronounced transition while in rural areas across all the regions, the transition is yet to occur.
Figure 2: Population pyramid by region and type of locality


Population by type of locality
Young people (15-35 years) are more in urban areas (7,125,070 ; 60.5%) than rural areas (4,657,544 ; 39.5%).
Figure 3: Population pyramid by type of locality
Urban population pyramid
Rural population pyramid
Male-Female population difference by region
Females (15,631,579) outnumber males (15,200,440) by 437,139 (2.8%) and also in urban areas ( by 5.0%). However, in rural areas males outnumber females by 0.3 percent. Also in six regions, males outnumber females, ranging from 5.1 percent in Western North to 0.5 percent in Bono East.
The male population below 20 years outnumber their female counterparts in all regions except Greater Accra.
The age group 30-64 years (predominantly the working age category) is dominated by males in Western North, Ahafo and Western regions.
Figure 4: Male-female population difference by locality
Note: In the figure above, left bars represent male, whereas the right female. The bars indicate the percentage point difference from an even split (i.e. 50.0%). Where 55% of the population are female, we would see a 5 percentage point red bar.
Population 18 years and older by sex
About 6 out of every 10 people (58.2% i.e. 17,931,673 persons) are 18 years or older.
Figure 5: Population 18 years and older by sex (%)
Working age and dependent population
Six out of 10 persons (60.4% - 18,619,021) are 15-64 years old. In six regions, the proportions are higher than the national average: Greater Accra (66.5%), Western (62.2%), Ashanti (61.4%), Bono (61.3%), Western North (60.8%) and Eastern (60.6%).
Age dependency ratio is 66, implying that there are 66 persons in the dependent age bracket (children 0-14 years and the elderly 65+ years) for every 100 persons in the working age bracket (15-64 years).
At the national level, 4.3 percent are 65 years and above. The proportions are higher in six regions than the national average: Volta (6.8%), Upper East (6.3%), Eastern (5.7%), Upper West (5.3%), Central (4.6%) and Bono (4.5%).
Figure 6: Working age and dependent population (%)
Background Information
Download the full report for data, information on methodology and data quality
Definitions and Concepts
Age
Age refers to how old a person was at his or her last birthday with reference to the Census Night, and is recorded in completed years.
Sex
Sex refers to whether a person is a male or female.
Age-Dependency Ratio
It is the ratio of the population 0-14 years and 65 years and older to the population 15 - 64 years. The ratio depicts the relationship between the population that is likely to be dependent and the working age population of the country.
Median Age
It is the age at which exactly half of the population is older, and half younger.
Population Pyramid
It is a graphical representation of the age and sex structure of a population. It depicts at a glance the population dynamics, including the youthfulness or ageing of the population of a country.
Related links
Difficulty in Performing Activities
Download
